The statistical illusion of better pregnancy outcomes for vaccinated women
- Norman Fenton
- Sep 5, 2022
- 7 min read
Updated: Sep 30, 2022
How can a lower still birth rate in ‘vaccinated’ pregnant women mean that they are at higher risk of a still birth? It is all about what stage of their pregnancy they get vaccinated – there is ‘survivor bias’ in those vaccinated late in pregnancy.
The following analogy is based on one used by colleague Prof Retsef Levi. Suppose we want to find out whether runners in a 40 km (that’s 26-mile) marathon are more likely to finish the race if they are given a special vitamin drink during the race. To do this we set up a drinking station at 20 km where runners can pick up the drink if they wish. Suppose 200 runners start the race and we observe the following:

The first row represents the runners who do not take the drink and the second row represents the runners who do. So, there are 100 in each group; but, whereas 70 of those who take the drink complete the race (70%), only 48 of those who do not take the drink complete it (48%).
It seems clear that taking the drink increases the chances of completing the race. But this may not be the case.
The problem is that in marathons many runners drop out before the 20 km mark. That means that such runners not only fail to complete the race but also fail to reach the drink station (and so are recorded in the ‘no drink’ category). This means the summary data above may be ‘hiding’ something like the following data on such runners:

In other words, of those who get the option of taking the drink, the completion rate 70% (70 out of 100) of those who do so is lower than the completion rate 80% (48 out of 60) of those who do not. In this hypothetical example taking the drink therefore lowers the chances of completing the race, despite the ‘overall aggregate’ data seeming to point strongly to the opposite conclusion. It is the survivor bias of those who make it past 20km that was causing the original flawed conclusion.
This analogy is important because there has been much recent furore over conflicting government reports about whether the Covid vaccine is safe and effective for pregnant women and it turns out that similar statistical ‘illusions’ may be at play when comparing pregnancy outcomes of ‘vaccinated’ against ‘unvaccinated’ women. This is especially true of outcomes relating to whether the pregnancy resulted in the birth of a healthy baby. Ultimately what people really want to know is: if there are 100 pregnant women, how many end up with a healthy baby? Many of the studies over-complicate things and fail to answer that question. Imagine if we simply make the following replacements to the above marathon example:
Starting marathon runners --> newly pregnant women
Runners who complete the race --> those who delivered a healthy baby
Vitamin drink at 20km --> vaccine at 20 weeks into the pregnancy
All the women reaching 20 weeks pregnancy must, by definition, have avoided early miscarriages** (which is when most pregnancy failures occur) and so the 'aggregate' results would suggest that vaccinated women are more likely to deliver a healthy baby than unvaccinated women. But again, the detailed result is that of those pregnant women who get to the option of vaccination, it is the unvaccinated who are more likely to deliver a healthy baby.
Of course, this is all hypothetical and over-simplified because pregnant women might get the option of vaccination at many different stages both before and during pregnancy and we have to take such information into account in order to arrive at a suitable risk assessment. But it turns out that this 'survivor bias' problem is still highly relevant to the real-world studies and data.
I have already explained in a previous article why the UKHSA’s regular vaccine surveillance reports are likely to be overestimating the safety of the vaccine because, instead of comparing the ‘never vaccinated’ with different categories of vaccinated women, they lump together the never vaccinated with those vaccinated pre-pregnancy into a single ‘no dose in pregnancy’ category and compare these with the ‘one or more doses in pregnancy' category. Here is an example of one of their graphs from the most recent report (and note this does not tell us anything about the chance a pregnant woman will give birth to a healthy baby since it deals only with still births** and not miscarriages in early pregnancy).

But things are much worse than I indicated in that article when it comes to comparing the overall chance of a successful birth per pregnancy, because the aggregated data ignore the massive confounding effect of women vaccinated late in pregnancy (i.e those who must have avoided early miscarriages** when most pregnancy failures occur).
Indeed, those claiming that the vaccine is safe and effective for pregnant women point to studies such as this which even seem to show the miscarriage and still birth rates of vaccinated women to be lower than that of unvaccinated women. But these studies do not properly factor in the stage during pregnancy when the vaccine was taken.
To understand the scale of the problem, consider the following hypothetical scenario:
Using the UKHRA classification, suppose that we observe 200 pregnant women of whom 100 have 'no doses in pregnancy' and 100 have 'one or more doses in pregnancy'. For simplicity we will refer to any miscarriage** or still birth** outcome collectively as a ‘foetal death’**. Suppose we observe the following hypothetical data in this group:


So, the ‘unvaccinated’ (no dose in pregnancy) have a higher foetal death rate, 26%, than the ‘vaccinated’ (one or more dose in pregnancy), 18%. This looks like very powerful support for vaccine safety with respect to avoiding foetal deaths.
But we need to take account of the confounding effect of women who are first vaccinated late in pregnancy. For simplicity, instead of considering the normal three trimesters of pregnancy we will consider just two stages ‘early’ (0-20 weeks) and ‘late’ (21-40 weeks), and we also need to properly distinguish the never vaccinated from those vaccinated at least one once before or during pregnancy, i.e. we need data for the following separate categories of vaccinated:
A: never vaxxed
B: vaxxed pre pregnancy only
C: vaxxed both pre pregnancy and early pregnancy (i.e. 0-20 weeks) or early pregnancy only
D: vaxxed both pre and/or early (i.e. at least once before 20 weeks) and late (i.e. after week 20)
E: vaxxed late only (i.e. after week 20)
Note that for every woman in categories D and E the pregnancy must have survived the first 20 weeks.
The following hypothetical data produces the same aggregate results (shown in bold) as the above table (there are no tricks or sleight of hand – the excel spreadsheet is here).

The rows represent different groups of women who got vaccinated (or not) at different stages of their pregnancy. The columns represent foetal deaths. The first column shows the total number of pregnant women whose foetal death rates are being compared. The next column shows the number of early foetal deaths (i.e. during weeks 0-20) and the column after that shows the total number of remaining pregnancies (note that women getting vaccinated ‘late’ in pregnancy have already passed through the most dangerous weeks 0-20 and since they remained pregnant, they must have zero foetal deaths in weeks 0-20). After that are the number of late foetal deaths (weeks 21-40) and then a column for total foetal deaths during pregnancy. After that are columns showing foetal death rates at different stages and the total foetal death rate.
While the aggregated results for ‘no dose’ in pregnancy (26% ) against ‘one or more dose’ (18%) is unchanged, look at the key results highlighted in yellow which were totally obfuscated from the aggregate data:
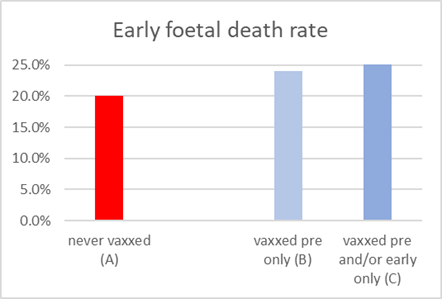
The never vaccinated (A) have a lower early foetal death rate 20% than either of the two vaccinated categories they can be directly compared with, namely those vaccinated pre-pregnancy only (B) 24% and those vaccinated pre and/or early pregnancy only (C) 26%. The never vaccinated also have a lower overall foetal death rate 24% than either of the two categories B and C (32% and 34% respectively).
The never vaccinated (A) have a lower late foetal death rate 5% than each of the different categories of vaccinated, (B) 11%, (C) 12%, (D) 11% and (E) 7%
These results can be summarised graphically as:


It is also important to note that there are many ways other than just survival bias in which the studies on vaccination safety and efficacy are heavily biased to favour outcomes for the vaccinated. Most notably, as anybody getting Covid within 14 days of first vaccination is normally defined as 'unvaccinated' ("the vaccine hasn't had a chance to work yet") this guarantees a statistical illusion of effectiveness even in a placebo. Similarly, those suffering an adverse reaction (including death) shortly after first vaccination are also often put in to the unvaccinated category which guarantees a statistical illusion of safety even in a placebo.
Conclusion: While the example uses only hypothetical data, it illustrates the limitations of the real-world studies claiming safety and efficacy of vaccines for pregnancy failures. For rigorous safety assessment, data on pregnancy outcomes require proper categorization of the vaccinated and unvaccinated and must include the data for each pregnancy phase (ideally 3 trimesters, but at least ‘early’ and ‘late’). Most real-world studies claiming vaccine safety are based only on aggregated data, and as such any safety claim is likely to be a statistical illusion that may be hiding strong evidence of lack of safety.
With thanks to Clare Craig, Josh Guetzkow, Retsev Levi, Scott McLachlan, Jessica Rose and others for their comments and insights
** Note that the terms 'miscarriage', 'still birth' and and 'foetal death' - all have different precise definitions timing wise, and the precise definitions vary between jurisdictions. It is best perhaps to consider them collectively as "deaths in the unborn".
A commenter has written this interesting article on the UK pregnancy data


Fascinating statistical breakdown! This analysis reveals how data presentation can mislead. Speaking of complex systems, have you tried Infinite Craft ? It's a game where you create intricate worlds through logical combinations, much like how these statistical models deconstruct pregnancy data. Critical thinking is key in understanding complex datasets.
Modresult is a website providing games and apps for the Android platform. Started in 2023 with a huge love for technology and we want to share it with you.
Please see some of my posts here: https://inumero.substack.com/p/vaccination-and-pregnancy-in-the . I have discussed this topic with Prof. Levi as well.
I would love your take on the Unherd interview on YouTube with the actuary Stuart McDonald. Fair sure you would make short work of it. ‘The great excess deaths mystery’.
Shouldn't the second group be divided into the following categories:
C. Vaxxed pre and early
D. Vaxxed early only
E. Vaxxed pre and early and late
F. Vaxxed early and late only
G. Vaxxed pre and late
H. Vaxxed late only
You can collapse D and C together, F and E together and H and G together.
Eg.
C. Vaxxed early OR vaxxed pre and early
D. Vaxxed early and late OR vaxxed pre and early and late.
E. Vaxxed late OR vaxxed pre and late
But there must be a vax during pregnancy.
Or perhaps I just don't understand how the "and/or" operator works.